Solana SOL’s trading activity today reflects a subtle yet significant momentum in an otherwise uncertain market. With the latest quoted price at $129.67, the cryptocurrency exhibits a minimal change, marking a 0.01% increase within a day. This price action occurs alongside a noticeable surge in trading volume, up by 35.97%, signaling heightened trading interest. Currently, Solana maintains a market capitalization of approximately $60.64 billion, securing its position as the fifth-largest cryptocurrency by market cap.
The day’s trading paints a picture of resilience as Solana attempts to navigate through the volatility that has characterized the crypto market recently. Despite broader market downturns, Solana shows potential signs of an impending rally, supported by an increased trading volume and a steady hold above the critical support level of $125.
Solana Eyes Key Resistance at $130 Amid Bullish On-Chain Sentiment
A closer examination of the daily chart reveals that Solana is contending with significant resistance and support levels that are crucial for its short-term trajectory. The cryptocurrency has rebounded modestly from a recent low, suggesting a testing phase near the $130 resistance mark. Should Solana breach this threshold, it could set the stage for further gains, possibly eyeing the next resistance at around $135.
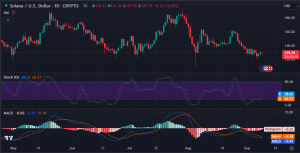
The Moving Average Convergence Divergence (MACD) on the daily chart indicates a slight bearish bias as it resides below the signal line, yet the proximity suggests a potential reversal if buying pressure continues. The Stochastic RSI underscores a market on edge, hinting at overbought conditions that may lead to price corrections if resistance holds firm.
However,on-chain metrics reflect a bullish sentiment. Data from CoinGlass reveals that the SOL Long/Short ratio stands at 1.103, indicating a leaning towards market optimism, as values above 1 generally suggest a bullish outlook. Additionally, SOL’s open interest has seen a 3% increase in the last day, signaling a heightened buying interest within the market.
SOL Treads Cautiously Near Key Levels as Momentum Remains Fragile
The 4-hour chart shows Solana’s intraday action where the price is trying to hold above $128.95, the 20-period EMA. This EMA is a temporary support for the price so Solana might be gearing up to test the near-term resistance again.
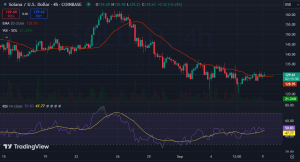
The 4-hour RSI is at 50.77, showing a neutral market momentum that matches the recent price action. It means downward pressure is being resisted but the way up is tricky. A drop below $125.61 could liquidate longs, and a move above $131 could liquidate shorts, both scenarios show Solana is in a delicate balance.
Solana (SOL) has popped up on investors’ radar as it has flashed a buy on the daily chart. This was tweeted by crypto analyst Ali Martinez. According to Martinez the TD sequential has given a buy signal from the lower boundary of the Solana channel which has been in place since April. If Solana gets inside this channel it could be looking at the middle and upper boundaries at $154 and $187 respectively.
This is in line with Martinez’s previous forecast where he said Solana could reach $1000 in this cycle. But if the lower boundary of the channel at $126 holds he could be wrong and Solana could drop to $110 or $90.