Four red flags that could crash XRP price in 2024
XRP, the native cryptocurrency of the Ripple network, is facing a bleak outlook in the coming weeks. According to various technical, fundamental, and on-chain indicators, XRP price could experience a significant drop in the near future. Here are red flags that XRP bulls should watch out for.
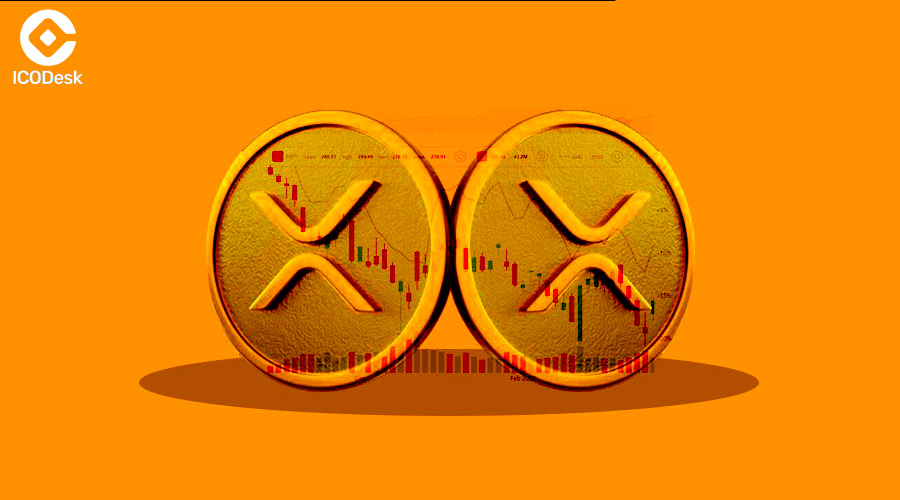
Bear flag pattern- On the weekly chart, XRP is forming a bear flag pattern, which is a bearish continuation pattern that signals a potential downtrend. A bear flag consists of a steep decline, followed by a smaller, upward-sloping consolidation. The pattern is confirmed when the price breaks below the lower trendline of the flag, and targets a move equal to the height of the previous decline.
As of Jan. 30, XRP is hovering near the lower trendline of the flag, indicating a possible breakdown. Moreover, the weekly relative strength index (RSI) is around 40, a neutral level that leaves room for further downside. If the flag pattern plays out, XRP could fall to US$0.24, a 55% drop from the current price, by May or June.
Whale dumping– Another bearish sign for XRP is the massive inflow of XRP tokens into crypto exchanges, which suggests selling pressure. According to data from Whale Alert, hundreds of millions of dollars worth of XRP have been transferred to Bitstamp and other exchanges in the past few weeks. This includes Ripple’s routine transfer of US$24.75 million worth of XRP from escrow to an unknown wallet on Jan 30.
The whale activity coincides with a shift in the distribution of XRP holdings. According to data from Santiment, there has been a decrease in the supply of XRP held by whales with 100 million to 1 billion tokens, and an increase in the supply held by entities with over a billion tokens, which could be exchanges. This implies that whales are either selling or redistributing their XRP holdings.
Death cross and head-and-shoulders pattern– On the daily chart, XRP is showing two bearish technical setups that could lead to further losses. The first one is a death cross, which occurs when the 50-day exponential moving average (EMA) crosses below the 200-day EMA. This is considered a bearish signal by traders and analysts, as it indicates a long-term downtrend. The last time a death cross occurred on the XRP daily chart was in December 2021, which was followed by a 65% price drop.
The second one is a head-and-shoulders (H&S) pattern, which is a reversal pattern that marks the end of an uptrend. An H&S pattern consists of three peaks, with the middle one being the highest (the head), and the two others being roughly equal (the shoulders). The pattern is completed when the price breaks below the neckline, which connects the lows of the peaks, and targets a move equal to the distance from the head to the neckline.
XRP is currently forming the right shoulder of the H&S pattern, and is approaching the neckline at around US$0.50. If the price breaks below this level, it could trigger a sell-off to US$0.30, a 40% drop from the current price.
No spot XRP ETF in sight– The final warning sign for XRP is the lack of a spot XRP exchange-traded fund (ETF) in the United States, which could limit the exposure and demand for the cryptocurrency. While several Bitcoin and Ethereum ETFs have been approved or are in the pipeline, XRP has not received any such attention from regulators or investors.
This could be due to the ongoing lawsuit between Ripple and the U.S. Securities and Exchange Commission (SEC), which alleges that XRP is an unregistered security. The legal battle has caused many exchanges and platforms to delist or suspend XRP trading, reducing its liquidity and market access. Until the case is resolved, XRP is unlikely to see a spot ETF in the U.S., which could hamper its growth potential.