
Will XRP Break Above $0.58? Analyzing Key Technical Indicators
As of September 16, 2024, XRP is trading at $0.5721, showing a marginal increase of 0.18% from its previous close. The price movement indicates that the cryptocurrency market is experiencing a period of consolidation, following a series of fluctuations earlier in the day. The market shows mixed signals, with periods of both bullish and bearish behavior.
Chart Analysis
Price Movement and Volume
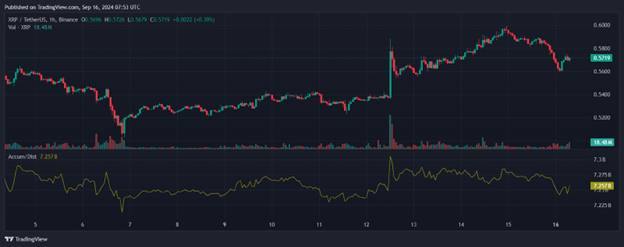
In the chart, hourly price movement of XRP against Tether (USDT) on the Binance exchange. The price fluctuates between $0.5696 and $0.5726 over the last several hours, suggesting a relatively tight trading range. The overall volume indicates steady trading activity, but there is no significant spike, which implies that the market participants are in a wait-and-see mode. The Accumulation/Distribution line is holding steady at around 7.257B, suggesting that despite price fluctuations, there is no significant accumulation or distribution by major traders, further supporting the consolidation theory.
Price Fluctuations and RSI Analysis
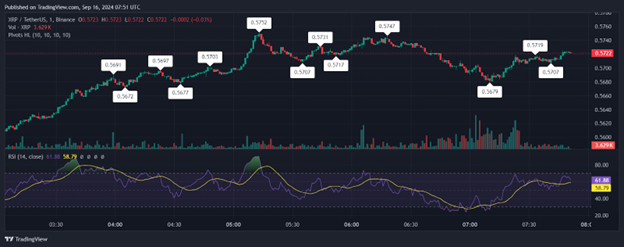
The Relative Strength Index (RSI) and highlights the pivot points (high, low) of the market price during the day. The RSI value is currently at 61.88, indicating a neutral to slightly bullish stance. The RSI has remained above the midpoint of 50 for most of the trading period, reflecting that buyers are somewhat in control. However, the lack of any substantial movement past the 70 level shows that there is not enough momentum to consider the market overbought.
Bollinger Bands Analysis
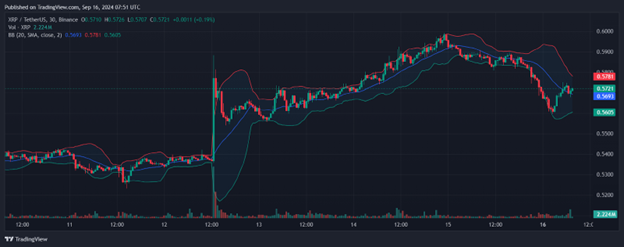
Bollinger Bands is to illustrate the volatility of XRP’s price. The price is moving close to the middle band, showing that volatility has remained relatively low. The lower and upper bands ($0.5693 and $0.5781, respectively) are tightening, further indicating a reduced price movement range. This contraction in the Bollinger Bands often signals an impending breakout, which could either move the price upward or downward depending on the prevailing market sentiment.
Exponential Moving Averages (EMA) Analysis
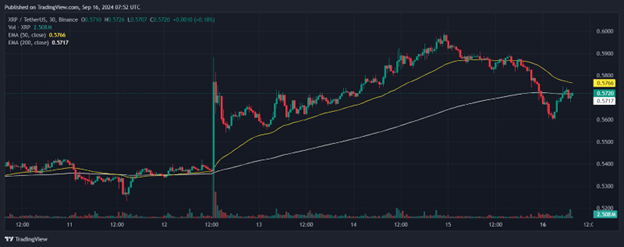
This chart shows the 50-day and 200-day EMAs for XRP. The current price is close to both EMAs, with the 50-day EMA ($0.5766) slightly above the 200-day EMA ($0.5717). This is a sign of a potential short-term bullish trend, as the 50-day EMA has crossed above the 200-day EMA (a golden cross), a classic technical signal indicating that momentum might be turning in favor of the bulls. However, the price remains close to these averages, suggesting caution as the market decides its next direction.
Key Technical Indicators
Volume: The trading volume is moderate, without significant spikes that would indicate large-scale buying or selling pressure.
Accumulation/Distribution Line: Holding steady, indicating a balanced market with no significant accumulation or distribution from major holders.
RSI: A neutral to slightly bullish position around 61.88, suggesting a mild buying pressure but no overbought conditions.
Bollinger Bands: The bands are tightening, indicating low volatility and a potential upcoming breakout.
Moving Averages: The presence of a golden cross between the 50-day and 200-day EMAs is a bullish sign, but with prices remaining close to both EMAs, the situation remains uncertain.
Market Sentiment and Possible Scenarios
Given the current indicators, XRP is experiencing a phase of low volatility and consolidation. The market is waiting for a catalyst to determine the next direction, which could come from broader cryptocurrency market movements, macroeconomic events, or significant news specific to Ripple (the company behind XRP).
Bullish Scenario: If buying volume increases and the price breaks above the upper Bollinger Band ($0.5781) with strong momentum, XRP could see a continuation of its upward trend. A break above the $0.5800 level would further validate a bullish trend, supported by the golden cross.
Bearish Scenario: Conversely, if XRP breaks below the lower Bollinger Band ($0.5693) and the 200-day EMA at $0.5717, it could indicate a bearish reversal. In this case, the price could fall to the next support level around $0.5600 or lower.
Neutral Scenario: The price may continue to move sideways between the current support and resistance levels. This consolidation phase might persist until a significant market event causes a breakout in either direction.
Currently, XRP is trading in a consolidation phase with mixed signals from various technical indicators. While there are hints of bullish momentum, such as the golden cross and slightly positive RSI, the low volatility and tight trading range suggest that the market is awaiting further signals before making a decisive move. Traders should closely watch for a breakout above or below the key Bollinger Bands and the reaction to the 50-day and 200-day EMAs to gauge the next direction of XRP’s price movement.
Market participants should be prepared for potential volatility, especially considering broader market events like the upcoming FOMC meeting, which may impact the U.S. dollar and, subsequently, the cryptocurrency market as a whole.