
Bitcoin experienced more than 3% losses on Feb. 13 as the United States inflation data came in higher than expected.
The January Consumer Price Index (CPI), is a price index that measures the average change in price over time for a market basket of consumer goods and services. The market basket includes food, automobiles, and rent.
The CPI rose 0.3% month-on-month and 3.1% year-on-year, according to data from the U.S. Bureau of Labor Statistics. The market was expecting a 0.2% gain over the month and a 2.9% annual increase.
An official press release from the U.S. BLS read,
“The index for shelter continued to rise in January, increasing 0.6 percent and contributing over two-thirds of the monthly all items increase. The food index increased 0.4 percent in January, as the food at home index increased 0.4 percent and the food away from home index rose 0.5 percent over the month.”
The government body also added, “In contrast, the energy index fell 0.9 percent over the month due in large part to the decline in the gasoline index.”
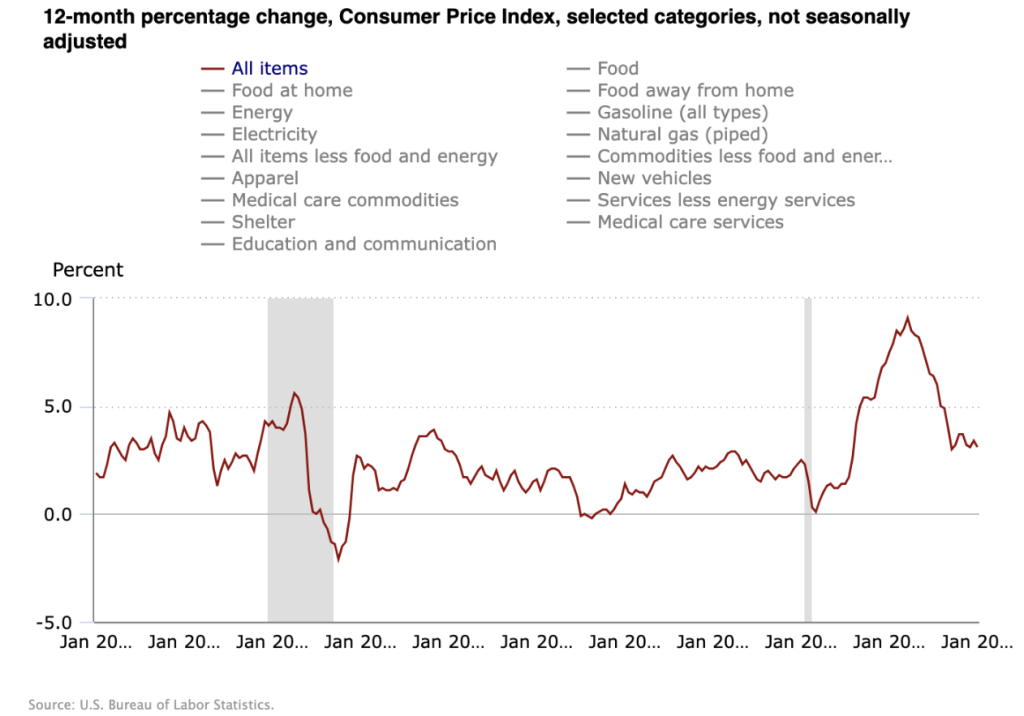
CPI % change chart. Source: U.S. Bureau of Labor Statistics
Markets immediately began reassessing the likelihood of the Federal Reserve cutting interest rates, shifting their timing from March to later in the year.
Bitcoin (BTC) lost around 3.3% on Tuesday after trading above $50,000 briefly. Ether (ETH) on the other hand was up around 2.2% at the time of publication.
Analysts say Bitcoin’s surge past the $50,000 key psychological level could be a sign recent headwinds are beginning to let up.
BTC breaks stiff resistance around the $50K level
After moving back and forth back and below the $50,000 mark, several analysts pointed out that the level was important for both bulls and bears and represented a stiff resistance for the price.
BTC broke above this level during the European trading session on Wednesday confirming that the price is ready to scale higher. The bulls will now try to send the price first toward $52,000, then $55,000 and later $60,000, before making a run for the all-time high above $69,000.
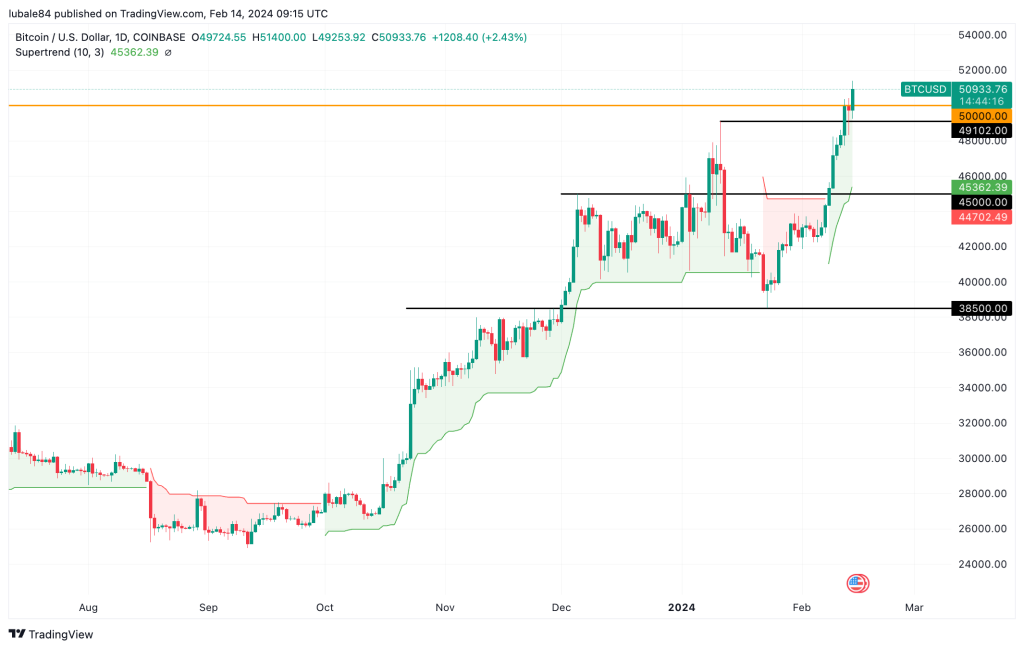
BTC/USD daily chart. Source: TradingView
Supporting this bullish outlook is the SuperTrend indicator, which flipped from red to green and moved below the price on Feb. 8, suggesting the start of the uptrend,
On the other hand, if the price slides back below $50,000, it would suggest the inability of the buyers to sustain higher levels. It would also mean that the buyers are booking profits after the price rose to $50,000. The price would then drop to $49,102 or $48,000.