
The Bitcoin price is trading at $66,677 as of 4:00 am EST, down 5% over the last 24 hours.
BTC price fell sharply from an opening of $69,681, dropping more than 5% to an intra-day low of $65,977 on April 2.
The largest cryptocurrency by market capitalization is now down 6% over the last seven days and its market capitalization has also reduced to rest at $1.31 trillion, according to data from CoinMarketCap.
While the previous bull market price action may play out and see the price drop further before the halving, the overall trend remains bullish.
Meanwhile, the macroeconomic factors are not looking so good. Federal Reserve Chair Jerome Powell emphasized his expectation that inflation would gradually decline toward the central bank’s target of 2%, despite the latest data showing a slightly higher inflation rate of 2.5% in February, up from 2.4% in January.
The Fed chair acknowledged that the path toward the 2% target might encounter occasional barriers along the way, as indicated by the Bureau of Economic Analysis report and other recent data.
Despite the acknowledgment of potential challenges, the Fed’s latest projections still suggest a plan to lower rates by 0.75% this year, reflecting a downward revision from the previous high of 5.25-5.5%.
Powell’s remarks underscore the central bank’s cautious approach to monetary policy adjustments amid evolving economic conditions and inflation.
Bitcoin price consolidates in an asymmetrical triangle
BTC price action since March 9 has formed an asymmetrical triangle on the daily chart, as shown below. This means that the price is losing momentum amid reducing price volatility. The relative strength index (RSI) has dropped to 49, suggesting a reduction in price volatility.
As such, the price could continue dropping if it produces a daily candlestick close below the triangle’s support line at $66,265. Significant support is anticipated around the $60,000 psychological level, with potential buying interest if the market pulls back to this level.
A drop lower could see the Bitcoin price drop to tag the bearish target of the prevailing chart pattern at $55,766. This would represent a 16% drop from the current level.
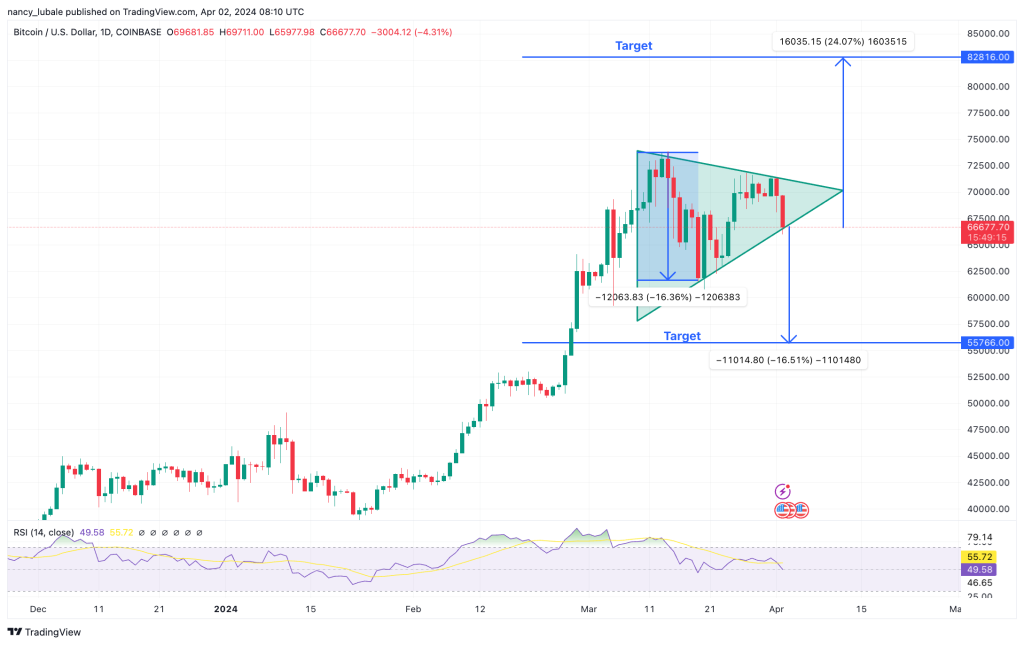
TradingView Chart: BTC/USD
On the upside, the price is still moving above all the major moving averages, and the SuperTrend indicator is still bullish in the monthly time frame.
As such, BTC could turn up toward the triangle’s resistance line at $71,390. A close above this level would confirm an upward breakout from consolidation, with the first level to watch being the all-time high at $73,835 and next the bullish target of the triangle at $82,816. This would represent a 24% increase from the current price.