
Bitcoin price rose to an intra-day high of $50,423 on Feb. 13 for the first time since December 2021, boosted by solid inflows into the spot Bitcoin exchange-traded funds (ETFs).
Bitcoin BTC) price rose rapidly by 6% from a low of $47,715 on Feb. 12 to hit a two-year high above $50,000 on Feb. 13. This followed 17% gains for BTC over the last 7 days.
Independent analyst and trader Daan Crypto Trades pointed out in a Feb. 12 post on X social media platform that net inflows into the Bitcoin ETFs have been positive for 11 consecutive days.
Today’s #Bitcoin Sent to out by $GBTC/Grayscale comes out to be ~2.9K $BTC or ~$138M worth.
Outflows from $GBTC remain relatively low.
Friday’s ETF net flows saw a massive +$541M increase. Second biggest day yet.
That makes 11 consecutive positive days of net inflows. https://t.co/xMqcq2TEHv pic.twitter.com/BZVTCQbXh7
— Daan Crypto Trades (@DaanCrypto) February 12, 2024
The analyst said,
“Friday’s ETF net flows saw a massive +$541M increase. Second biggest day yet.”
Coinshares’ Digital Asset Fund Flows Weekly Report shows that spot Bitcoin ETFs attracted over $1.1 billion in netflows last week as outflows from the Grayscale Bitcoin Trust (GBTC) continued to slow down.
James Butterfill said in the report published on Feb. 12 that the “newly issued spot-based Bitcoin ETFs in the US, saw a net US$1.1bn inflows last week, bringing inflows since the January 11th launch to US$2.8bn.”
🟢 Digital assets start the week with US$1.1bn inflows!
AuM is at its highest level since early 2022, at US$59bn.
– ETFs dynamics –
📈 The momentum of inflows into new issuers is not slowing down. Newly issued US spot-based Bitcoin ETF now total US$2.8bn inflows since their… pic.twitter.com/kGqVU6jX62
— CoinShares (@CoinSharesCo) February 12, 2024
Recent spot BTC ETF inflows and the uptick in Bitcoin’s price bring the total assets under management (AuM) to $59 billion, the highest since early 2022.
The sudden rise of the Bitcoin price on Monday resulted in $134.8 million short position liquidations on Feb.12, according to data from Coinglass. Bitcoin short position liquidations amounted to more than $60.56 million against $20 million long liquidations.
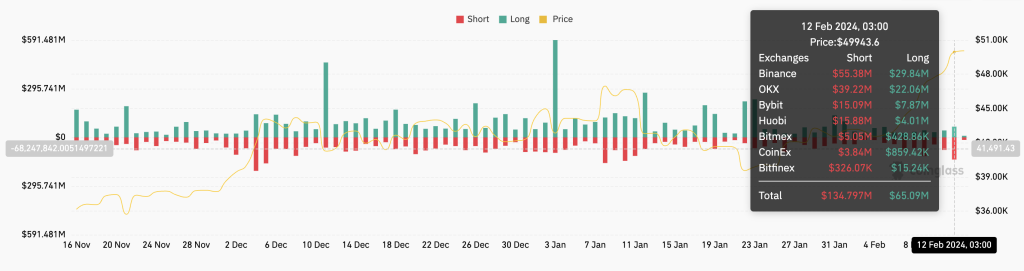
Total crypto liquidations chart. Source: Coinglass
Could Bitcoin extend its move toward new all-time highs? Let’s analyze its technical set-up to find out.
Bitcoin price analysis
Bitcoin broke above the Jan. 11 high of $49,102 on Feb. 12, signaling the start of the next leg of the uptrend on Feb. 12.
Many analysts expect the bull-run to continue, and even though short-term risks of a pullback remain, the long-term picture looks encouraging.
According to Glassnode, a number of on-chain indicators are showing signs that Bitcoin could be in the initial stages of a bull market.
All the major moving averages were facing upwards and the position of the relative strength index (RSI) in the overbought region attested to the dominance of the buyers in the market. The price strength at 78 suggested that there was still more room for the upside.
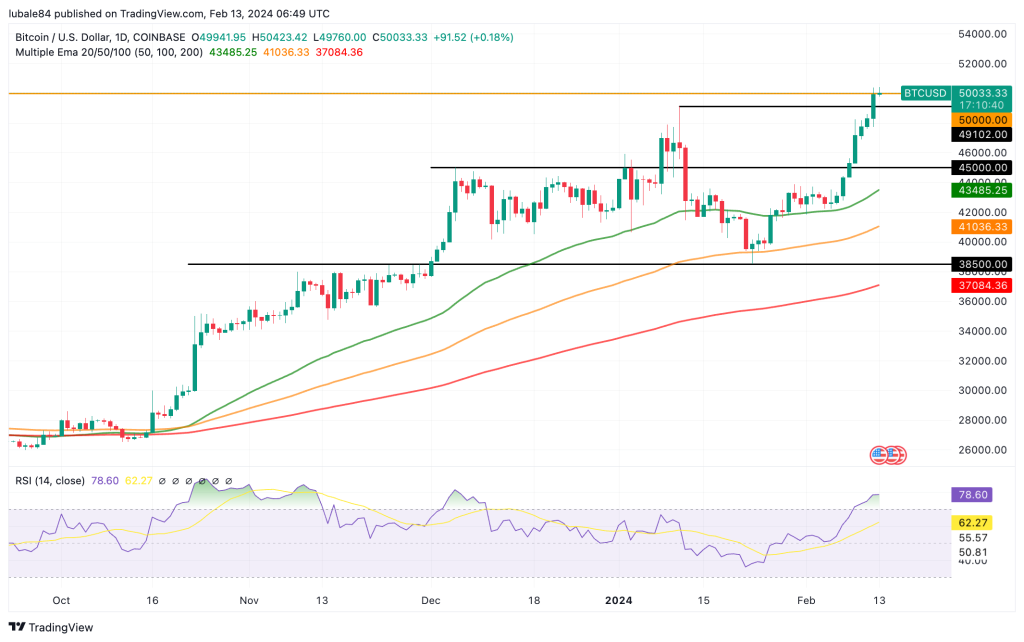
BTC/USD daily chart. Source: TradingView
As such a daily candlestick close above $50,000 will confirm the breakout and set the stage for a possible rally to $52,000. The $50,000 mark is currently acting as a significant level for both buyers and sellers, but bulls are likely to prevail. A strong momentum could clear the path for a potential rise to $60,000 and later to the Nov. 10, 2021 all-time high around $69,000..
On the downside, if the price of the pioneer cryptocurrency turns down and breaks back below $49,102, it will suggest that the bears are selling on the rally to $50,000. That will increase the risk of a fall to the psychological level at $45,000.