Solana price climbed 40% over the last 10 days to reach a new multi-year high of around $150. SOL rose rapidly on March 7 from lows of around $130, climbing 14% to a high of $149.57.
At the time of writing, SOL was trading at $145, up 4% over the last 24 hours and 15% over the last week, according to data from CoinMarketCap and TradingView.
A 300% leap in trading volume accompanied SOL’s price growth over the same period peaking at $8.90 billion on March 5. With a market capitalization of $64.4 billion, Solana is positioned at #5, according to the CoinMarketCap ranking.
Let’s look at SOL’s technical setup and see where it could be headed next.
Solana price analysis
SOL escaped from an inverse head-and-shoulder (H&S) pattern on FEB. 13 to reach $120. Supplier congestion at this level pushed the price below the pattern’s neckline to $107 but the 50-day exponential moving average (EMA) at $91 provided a safe haven for the buyers.
Using the 50-day EMA as a launchpad, the smart contracts token embarked on another uptrend, shattering the resistance at $120 on Feb. 29 before reaching the optimistic target of the governing chart pattern at $135. Buyers pushed the price above this target on March 7 in an uptrend that has seen SOL get within an inch of the $150 mark.
Note that for the buyers to sustain the uptrend, the price should produce a decisive close above $150, bringing areas around $180 and eventually $200 into the picture.
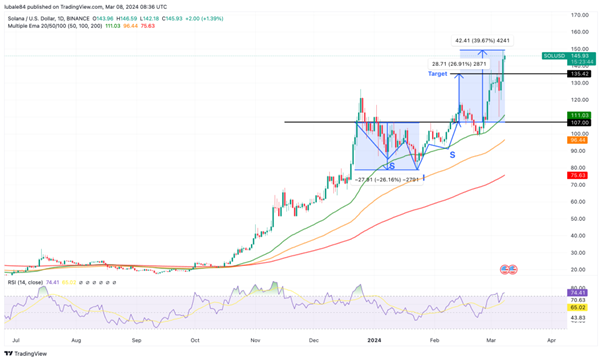
TradingView Chart: SOL/USD
SOL’s bullish narrative was supported by the upward-facing moving averages which were moving below the price. This also meant that the price enjoyed relatively strong support on the downside.
The relative strength index (RSI) had moved back into the overbought region, and the price strength at 74 suggests that the buyers are still in control.
On the downside, profit-taking at the current level would see Solana drop first toward $140 and later to the support at $125. If Bitcoin continues its uptrend, this is where SOL’s downside could be capped in the short term.