
The Celestia price is trading at $18.76 as of 3:30 am ET, down 0.6% over the last 24 hours and 7% over the last seven days.
In the longer timeframe, TIA remains bullish, with over 260% gains over the last 90 days. The modular token shows signs that it is closer to triggering a rally. But there might be a dip before the TIA bulls kickstart an explosive move to the upside.
Let’s look at Celestia’s price action to ascertain where it is headed next.
TIA approaches key levels in the short-term
After finding support from the $14.00 buyer congestion zone on Jan. 23, the TIA price rose more than 50% to set a swing high at $21.14 on Feb. 10.
The price then embarked on a downtrend as buyer exhaustion and profit-booking set in. The price now trades 14% lower than this high with sellers determined to take the price even lower.
All the major moving averages are still pointing downward, and the relative strength index (RSI) is positioned at 41, suggesting that the market conditions still favor bearish traders.
The support at $18 and the 200-day exponential moving average at $17.8 are key levels to watch on the downside. Other lines of defense may arise from the 50% Fibonacci retracement level at $17.5 and the major support level at $16.8, embraced by the 38.2% retracement level.
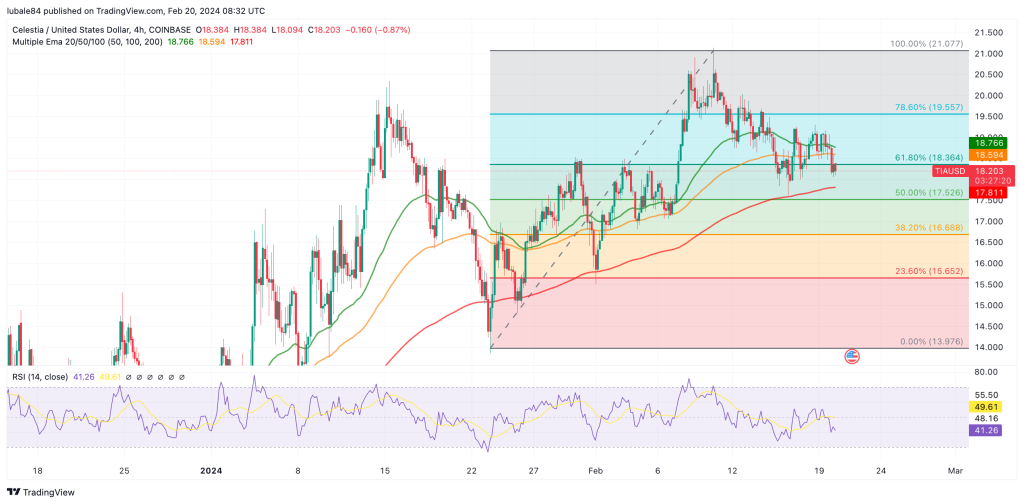
TIA/USD four-hour chart. Source: TradingView
On the upside, Celestia’s price has been oscillating within the $ 13.88 to $20.33 range for over a month. However, TIA has been moving sideways above the four-hour support level at $18. Investors can expect the altcoin to sweep the range’s upper limit at $17.8 (200-day EMA), which could be a buying opportunity for sidelined buyers.
Higher than that, the price could potentially overcome this barrier at $19.5 embraced by the 78.6% Fibonacci level and tag the 100% Fibonacci Extension level at $21. This move would constitute a 16% rally from the current price.