
The Chainlink price was trading at $20 as of 6:30 a.m. EST, aping the “up only” move displayed by Bitcoin since October 2023.
LINK is up 32% over the last month and 226% over the last six months. From a technical point of view, Oracle’s token appears strong to continue this uptrend and aim for higher highs.
LINK bulls target 25% gains
Chainlink’s price action since Jan. 23 has recorded a series of higher highs and higher lows, leading to a parallel rising channel on the four-hour chart (see below).
LINK, however, has pulled back in an uptrend, suggesting that the bears were booking profits on the latest rally to $20.85.
Pullbacks do not usually last for more than three days during strong uptrends because the bulls jump in to buy on every minor dip. If the price turns up and breaks above Feb. 12th’s high around $20.85, the LINK price could soar to the pattern target of $22.43.
A daily candlestick close above this level would confirm a bullish breakout from the pattern paving the way for a return to $25. This would bring the total gains to 25% from the current levels.
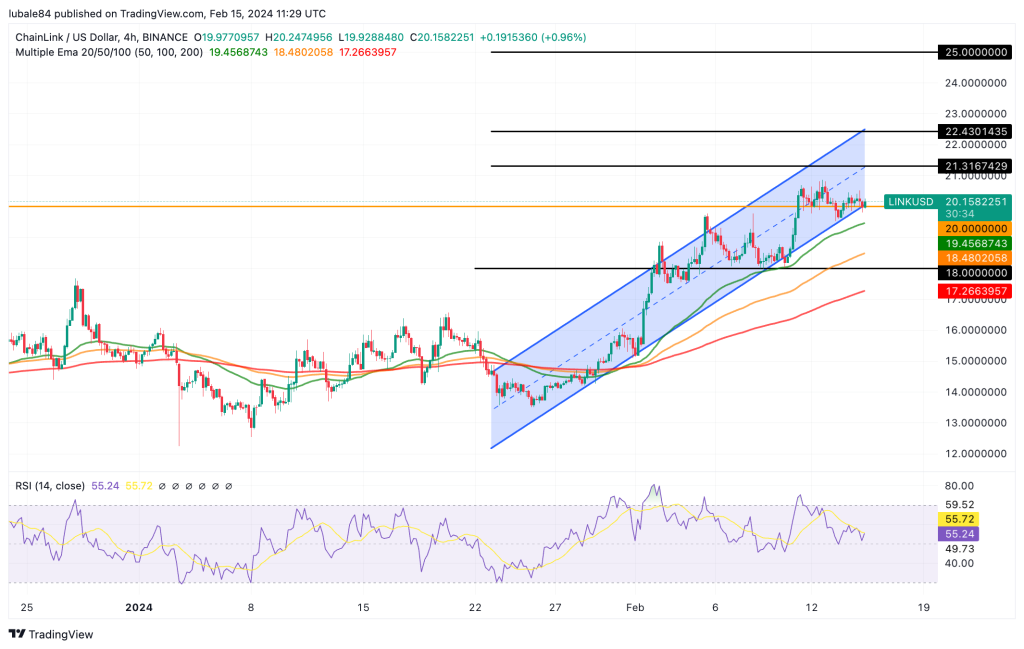
LINK/USD four-hour chart. Source: TradingView
Apart from the bullish technical formation, Chainlink’s upside was supported by the upward movement of the exponential moving averages (EMA). The relative strength index (RSI) was also moving upward, indicating that the short-term traders had begun returning to the market.
On the other hand, the bears are likely to have other plans. They will try to pull the price below the 50-day EMA ($19.45), which will be the first sign of weakness. The pair may then retest the breakout level of $18.