Cryptocurrency Ripple has shown a very interesting price action this year. Ripple (XRP) price soared to $0.92 after the company’s legal win against the Securities and Exchange Commission of the United States. However, the coin lost all the gains in the following weeks as the BTC price slid below $30,000.
Thanks to the recent surge in Bitcoin, XRP bulls are back in the play and have pushed the price to fresh 3-month highs. At the time of writing, the native asset of the Ripple ecosystem is changing hands at $0.653 after a brief pullback from its weekly high of $0.732.
Ripple Latest News
According to the latest XRP news, Ripple and SEC have submitted their agreed upon schedule for the settlement discussions to Judge Analisa Torres whose recent judgment concluded that XRP coin was not a security.
The US regulator and the fintech firm have been in a legal stand-off for years. The settlement phase may result in a win-win for both parties. However, after the court ruling of July, any face-saving for the SEC appears very hard to be achieved.
Ripple CEO Brad Garlinghouse has recently stated that the court proceedings for the SEC lawsuit have cost the firm more than $100 million in legal expenses. It is also worth mentioning that unlike retail sales, the XRP sales to the institutions were declared securities by the US court. Therefore, Ripple is still liable to pay damages.
XRP/BTC Outlook
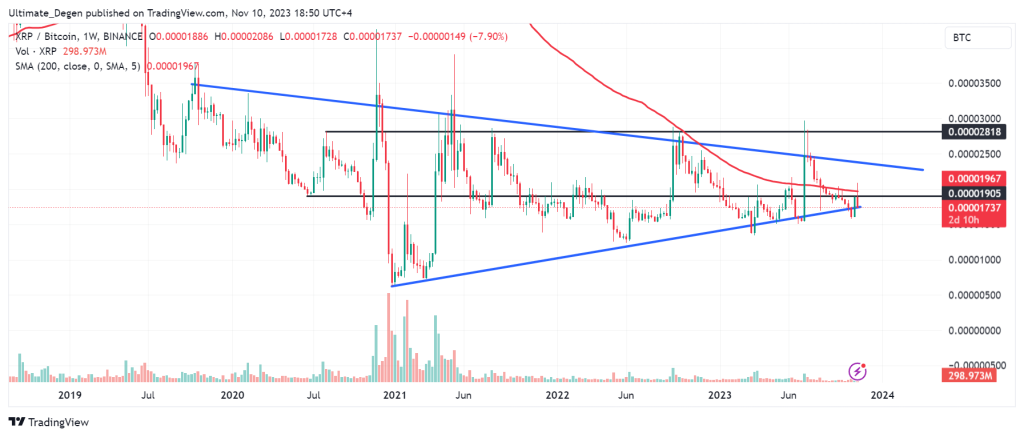
A higher timeframe analysis of the XRP/BTC chart depicts the formation of multiple patterns that points. Let’s try to understand what these patterns mean in the context of the following chart.
You may clearly see a symmetrical wedge pattern drawn with blue lines on the following chart. While a breakout from this pattern seems far away, it still shows how the price has been respecting this pattern since October 2019.
However, the most significant level on the Ripple price chart is the $0.000019 level, which is very close to the 200-day moving average. I am eagerly waiting for a reclaim of this level as this will flip the XRP price prediction very bullish.
Ripple Price Prediction & Technical Analysis
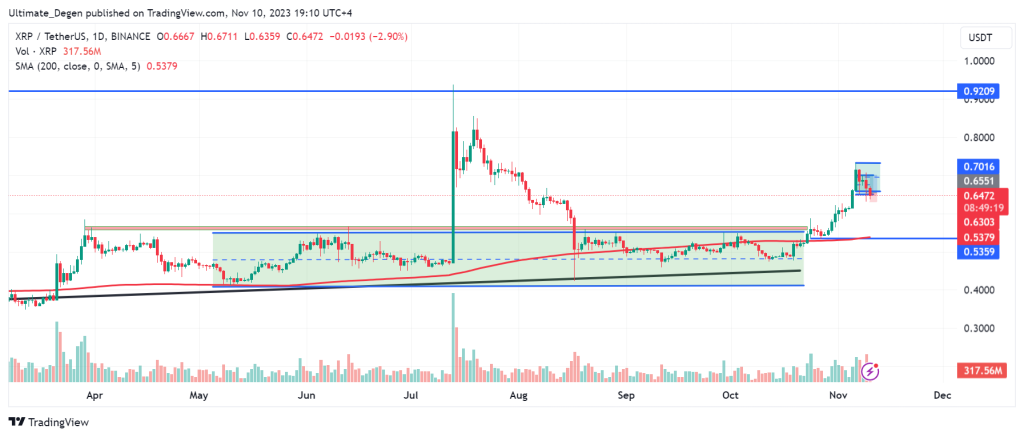
The daily chart of XRP to USD shows a strong bullish push from the October lows. The price is up 50% from the lows and the outlook is looking very positive due to a higher high on the daily chart. I still believe there is a strong possibility of another retest of the $0.92 level before the end of this year.
Ripple price prediction will turn bearish for me if the price loses $0.53 support. This will also result in a breakdown below 200 MA which could be a major sign of weakness. Therefore, I’ll be carefully watching the level marked on the following chart.