
The crypto market’s flash crash on Jan.3 suggested that the market participants were sensitive to any news surrounding the long-awaited decision on the spot Bitcoin ETF applications by the United States Securities and Exchange Commission (SEC).
Bitcoin (BTC) led the cryptocurrency markets lower on Jan. 3 dropping as much as 10% to send a swing low around at the $40,800 area. The largest crypto by market capitalization lost 13% of its value before finding solace from the $2,000 support zone.
Other top 5 non-stablecoin cryptos also felt the brunt of the flash crash with “Ethereum killer” Solana (SOL) dropping as much as 22% toward $85. The payment token XRP lost 21% to $0.5046 within just a few hours.
Although the correction appears to be cooling down the bullish sentiment in the short term, it does not alter the prevailing trend. As market observers will keep a close eye on the SEC, any positive news on the approvals of the Bitcoin ETFs could cause a sharp reversal to the upside.
What important support levels may arrest the decline in Solana and XRP?
Solana Price Analysis
SOL’s recovery stalled at $125 on Dec. 25, 2023, indicating that traders are selling on the rally to this level.
The selling which began on Boxing Day accelerated on Jan. 3, and the sellers sank the price below the $90 psychological level. At the time of writing, Solana was hovering around $100, down 7.8% on the day.
If the price sustains above the $100 psychological level, the SOL/USD pair could rise to the $115 resistance level and later to the $126 swing high.
SOL/USD Daily Chart
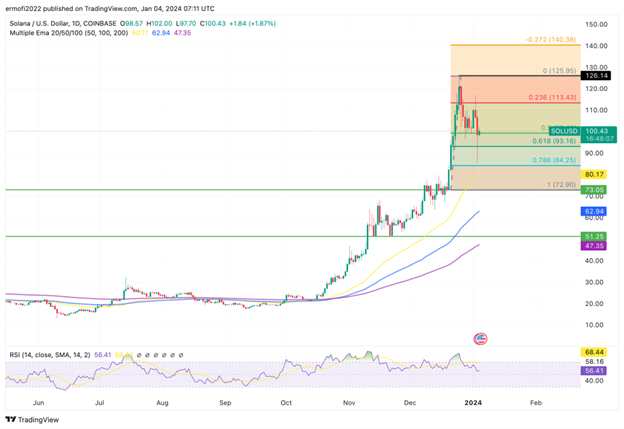
The rising moving averages and upward-facing relative strength index (RSI) supported the positive outlook.
On the downside, if the price drops below$100 to revisit $90, it will indicate solid selling at higher levels. That may start a decline back toward the $80 to $73 support zone, where the buyers are expected to pose a strong challenge.
XRP Price Analysis
XRP is currently trading at $0.5807, down 8.67% over the last 24 hours. The price action had formed a descending triangle pattern on the daily chart, which targets a close below $0.57.
The bears pulled the price below $0.57 on Jan. 3 to set a swing low around $0.50, but the bulls aggressively bought the dip, as seen from the long lower wick on the day’s candlestick.
If the price rises back above $0.6, the bulls will try to start a recovery toward the downtrend line.
XRP/USD Daily Chart
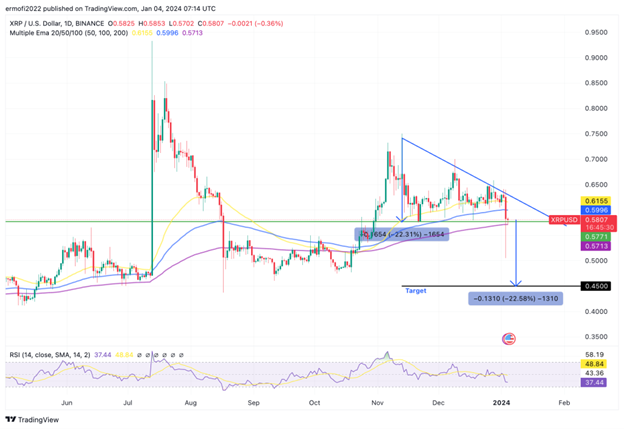
On the contrary, if the price drops below $0.57, it will signal the confirmation of the bearish setup. The XRP/USDT pair could then nosedive to $0.45 and eventually to the pivotal support at $0.4112