
Celestia Price Prediction: TIA is at Risk of 60% More Losses to $5
The Celestia price is trading at $13.65 as of 2:45 am ET, barely changing over the last 24 hours. The TIA price has been displaying a sideways price action since Monday last week.
There has been a slight decrease in the trading volume, down 3.5% on the day to rest at $90 million. With a market capitalization of $2.36 billion, TIA is at position 53, according to the CoiMarketCap ranking.
The appearance of a bearish technical formation could cause the Celestia price to bleed more over the next few days.
Celestia bears could exploit a rounded bottom pattern to $5.5
TIA’s price action between Dec. 19, 2023, and March 25 has formed a rounded top, as shown on the daily chart below. This started as a series of higher highs in the run-up to the all-time high of $21.14 on Feb. 10. This was subsequently followed by a string of lower highs and lower lows to the current level. Forming the rounded top, a bearish setup, points to further losses for the modular blockchain token.
All the major moving averages were facing downward, a suggestion that the bears were in control. Also, these moving averages presented areas of stiff resistance for the TIA price in its recovery path. These were areas defined by the 100-day exponential moving average (EMA), the 50-day EMA, and the 20-day EMA at $14.3, $15.7, and $14.9, respectively.
Moreover, the relative strength index was moving within the negative region below the midline. The price strength at 40 suggested that the sellers were still in control of TIA.
Therefore, Celestia price could see a retest of the $13.0 psychological level or the low neckline of the prevailing chart pattern at $11.85. A daily candlestick below the neckline would confirm a bearish breakout from the rounded top, projecting a drop toward the $5.4 support floor. Such a move would constitute a 60% correction from the current level of $13.65.
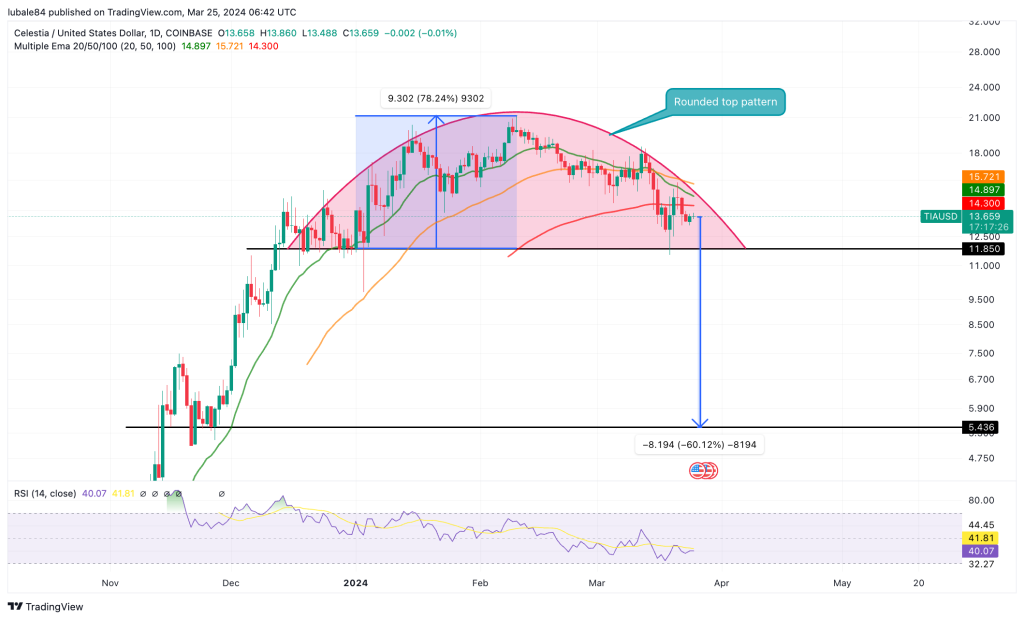
TradingView Chart: TIA/USD daily chart
On the downside, things could go awry for bears if TIA turns up from the current price to produce a daily candlestick close above the 100-day EMA) at $14.3. In such a case, Celestia’s price could climb toward $16, overcoming resistance provided by both the 50-day and 50-day EMAs. This development could see the Celestia price attempt a 54% rally and return to the all-time high of $21.14.