
The Ethereum price is up 0.16% over the last 24 hours to trade at $2,964 as of 2:00 am ET.
At the time of writing, ETH was fighting resistance from the $3,000 psychological level, following a stunning 26% run over the last month and 42% over the last 90 days.
Ether’s strong performance has been attributed to the deflationary supply, the new Ethereum staking feature, increased DeFi applications and the proof-of-stake burn mechanism.
While all these features paint a bullish outlook for Ether, are the bulls strong enough to overcome the resistance at $3,000?
Ether’s uptrend remains intact
ETH price action since Feb. 5 has been characterized by a series of higher highs and higher lows, leading to the appearance of an ascending parallel channel on the daily chart.
As long as Ethereum continues to trade within the confines of the rising channel, it will continue to rise. As such, a daily candlestick close above $3,000 would mean that the bulls are aggressively defending this level and are determined to flip it into support.
Such a move would confirm a bullish breakout, with the next logical move being a rise toward the upper boundary of the governing chart pattern at $3,170. This would represent a 7% ascent from the current price.
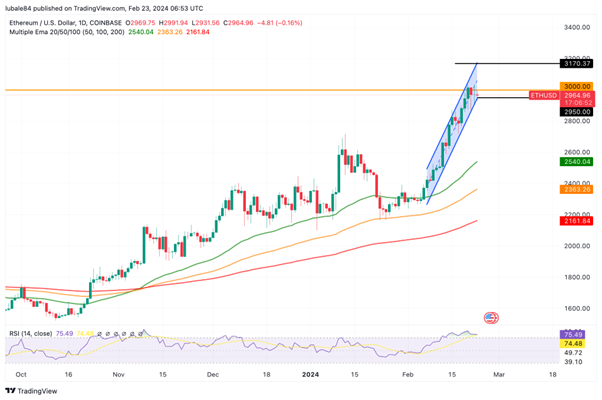
ETH/USD daily chart. Source: TradingView
Supporting the upward outlook for Ether were the up-facing moving averages and the position of the relative strength index (RSI) in the overbought region. The price strength at 75 suggested that the bulls still controlled the market.
On the downside, the RSI showed that Ethereum is extremely overbought. The ongoing correction suggests that the uptrend is losing momentum as traders book profits on the latest run up to $3,000.
An extension of the correction would see ETGH drop to seek solace from the lower boundary of the ascending chart pattern at $2,964. A drop below this would lead to a deeper correction toward $2,800 and later to the 50-day exponential moving average (EMA) at $2,540.